How To Read Crypto Trading Charts
As the global acceptance of cryptocurrencies expands, so does the curiosity and interest in crypto investments. Similar to how technical charts aid traditional traders in choosing equities and commodities, crypto charts are invaluable tools for making informed investment decisions in the realm of digital currencies.
Understanding Crypto Charts: Unveiling Patterns and Opportunities
Crypto charts, graphical representations of historical price, volumes, and time intervals, become the canvas upon which patterns of the past price movements of digital currencies are painted. These patterns serve as guides, enabling investors to identify potential investment opportunities. To delve into the art of reading a crypto chart, let’s explore the intricacies of the Japanese Candlestick chart.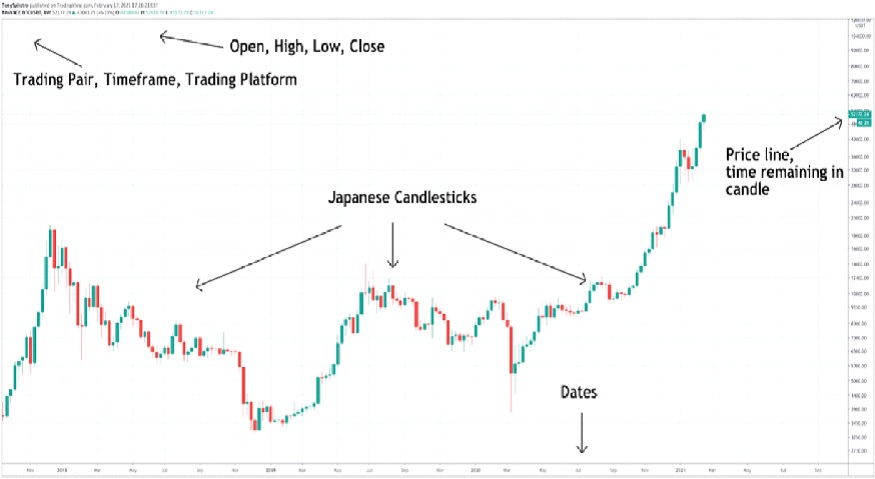
A Japanese Candlestick, a favored chart among crypto traders, employs color to convey significant information. A red candle signifies a closing price lower than the starting price within a specific time frame, indicating a decline. Conversely, a green candle represents a closing price higher than the starting price, signaling an increase. These candlestick charts, diverse in shape, color, and size, form various patterns, influencing traders in making strategic decisions.

Identifying Bullish and Bearish Patterns: The Trader’s Palette
Patterns on crypto charts can be categorized into two main types: Bullish Reversal Patterns and Bearish Reversal Patterns. For example, the Hammer Candle Pattern serves as a bullish reversal indicator, suggesting that a stock is approaching the bottom in a downtrend. The short body of the candle symbolizes the head of the hammer, while the longer wick implies sellers driving prices low, followed by strong buying pressure to conclude the session on a positive note. Validating the upward trend requires vigilant observation for a few days, coupled with an increase in trading volume.
Conversely, the Shooting Star Candle Pattern is a bearish reversal signal, typically occurring at the peak of a rally. This pattern, characterized by a candle with a long upper wick and a small body, points to drive-by buyers encountering resistance.
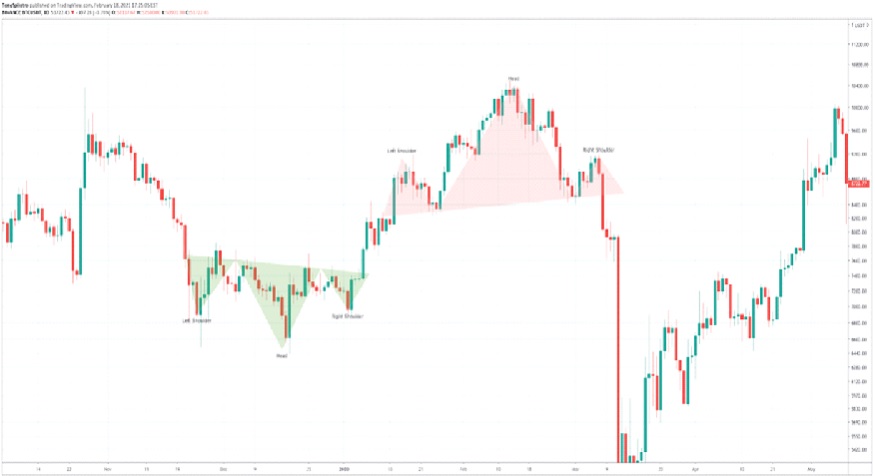
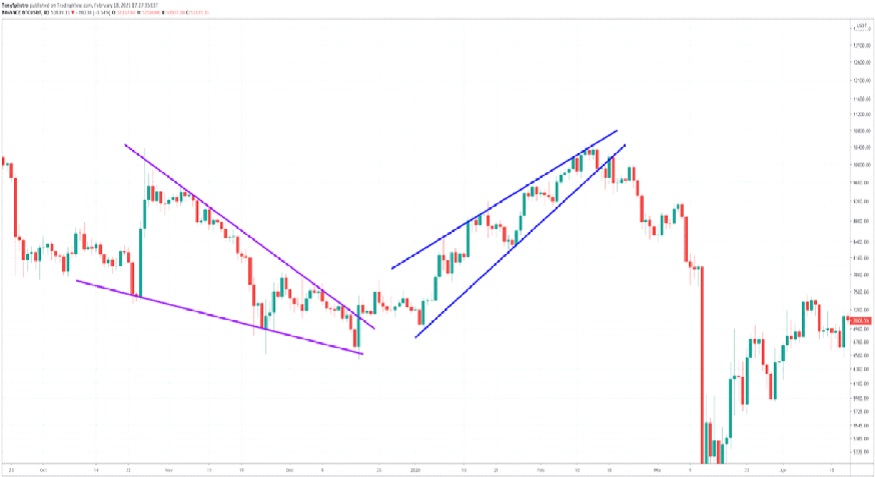
Exploring Technical Analysis Patterns: A Visual Symphony
1. Head and Shoulders Patterns: These reversal patterns can manifest at the peak or bottom of an ongoing trend, reflecting a battle between buyers and sellers that culminates in a pushback or pullback.
2. Wedge Patterns: Evident in the provided image, wedges emerge as trends settle, ultimately resulting in a breakout. Markets often sway sideways, creating a wedge until they decisively move in a firm direction.
Deciphering Support and Resistance: Key Elements in Crypto Chart Reading
Understanding support and resistance is pivotal in navigating the intricacies of a crypto chart. Support levels denote a price level that the asset does not fall below for a fixed period. In contrast, resistance levels signify the price at which the asset is not anticipated to rise further. This level symbolizes the equilibrium point where sellers outnumber buyers in the market for a specific digital asset. Seasoned experts often recommend support and resistance levels to guide traders in making informed decisions when positioning themselves in the crypto market.